Do you have a clear view of how your clients go from first hearing about you to becoming loyal customers? This is a process we call customer journey, and understanding and getting good data insights across each step in the journey can help you attract more ideal clients, create better relationships and improve sales ROI.
That’s what we’re covering this week, continuing on the trail of customer journeys and I have to say it’s so great to be taking this journey with you, because this podcast is part of my customer’s journey.
And I’m always inviting you to have a conversation, because that’s the natural next step if you’re looking for help to accelerate your business growth, which is exactly what happens inside the iSuccess Business Academy!
For now, let’s dive into this week’s topic, which is all about building a business dashboard for customer journey tracking.
PREFER TO LISTEN?
Do you have a clear view of how your clients go from first hearing about you to becoming loyal customers? This is a process we call customer journey, and understanding and getting good data insights across each step in the journey can help you attract more ideal clients, create better relationships and improve sales ROI.
In this episode, we’ll first touch on what a customer journey is and why you should pay attention to yours.
Then we’ll look at how you can track and trace your customer journey to make sure you’re making continuous improvements both for converting clicks to clients and for the overall customer experience of your brand. I’ll give you ways to optimise the customer journey and finish up by sharing 7 steps to creating a customer journey data analytics business dashboard.
So first…
What’s a Customer Journey and Why It’s Important
A successful customer journey is one that delivers a good experience for your ideal prospect from first finding you to becoming a customer or client.
The backbone of a customer journey is your marketing funnel and sales process and it’s best to pin down the ideal route before you start building in complex route alternatives.
If you’re moving to digital online ways of doing business, it can be hard to get your head around all the different media channels and ways of interacting with your potential customers.
Consultants, coaches and other practitioner professions are very orientated around a high-touch, in-person way of engaging with people. But as we’re all starkly aware, the world has shifted, especially with the onset of the pandemic when face-to-face customer engagement pretty much disappeared.
In today’s digital age, the customer journey has shifted too – with many more touch points, automations and re-engagement loops rather than a linear step-by-step model. That’s not to say that everything has to be digital, especially as social distancing eases up. A blend of both digital and human interaction can be incredibly powerful.
One of the reasons is that customers are quickly turned off if you offer them irrelevant products or services, so you need to be quite agile to spot where and when to redirect and re-engage their attention.
The first step is to really do your homework, business intelligence, market research, asking your people, will help you share things that are relevant to your clients needs and what’s happening in their business, life or industry.
On the journey, you need to guide your prospect through stages of awareness and education that help support their buying decisions – from resonating and aligning well with your product, service, or solution, to the point of sales transaction, onboarding and working with you, to renewing, retaining or upselling.
It follows then, hopefully, that monitoring your customer journey data gives you the ability to track and analyse how customers use combinations of channels to interact with you so you can improve every key moment along the path of interaction.
There’s a few previous articles/episodes that are helpful here.
How to Enrol Consulting Clients the Leveraged Way looking at the shifts you need to make to be strategic rather than tactical, Client Acquisition Process Mapping to Improve Workflow Efficiencies and Building an Effective Sales Process.
The common thread here is to get really clear on your ideal customer journey, map it out and make sure you’re seeing what’s happening across the entire end-to-end process.
To create a map of your ideal customer’s journey, visualise how your customers find you, and how they get from point A – the entry point – to point B – the point of sale.
If you refer back to our three systems for getting clients – the Engage-Educate-Enrol – pathway. That’s your customer journey – from attraction system where they opt-in or connect with you, to relationship system where you build and nurture the connection, to the sales system – your process for getting a client signed up with you, perhaps a one-click payment or a free consult.
Creating a map can reveal insights into your customers’ motivations, show you what’s working and what isn’t, and help you understand how to gain more customers while keeping the ones you have.
Let’s next take a quick look at
Setting Up ‘Track & Trace’ Data Points for Your Customer Journey
A customer journey map is a visual illustration of the customer’s experience with a business – sometimes called customer ‘touch points’. Customer journey maps are also kind of a snapshot of how you envisage the customer experience through your marketing funnel, online engagement and sales process.
While you can map out the customer journey as a visual series of steps, you can use forecasting tools to plug in some numbers, and you can build it in terms of a sequence or funnel, at some point you’ll want to go from theorising to actual evidence.
However, to create a useful and actionable customer journey map, you’re going to need data. As customer journey specialists Pointillist point out (excuse the pun):
Journey analytics are data-driven. Pictures without data are just stories; data is what makes the picture come alive.
Using data, you can track how customers move through your funnel from top to bottom, or rather across your end-to-end customer journey. You can also use data to inform how you interact with customers who are at various stages of the customer journey. What this means is that data can help you turn someone who is just casually interested in what you do into a paying customer.
Let’s look at a customer journey scenario.
Say a lot of your website visitors arrive on your home page or blog searching for the answer to a specific question. You could then create a resource or whitepaper that answers this question, which is going to help you capture these visitors as leads. You can then cleverly use message automations to nurture and segment based on what emails they’re opening and what they’re clicking on.
That way, you’ll be moving the best fit people through to your sales process by inviting them to an exploratory call or a free session or trial. This is your funnel!
Using journey analytics, you can dive a little deeper to discover answers to complex questions about customer behaviours and customer experience.
We’ll look at the data analytics side a little later. But first let’s just touch on the power of data-driven insights for optimising your customer journey.
Ways to Optimise the Customer Journey
According to a recent Aberdeen study summarised here, organisations today are rich in data, but poor in insights. Yet data-driven insights can help a business to improve on many steps in the customer journey process.
From relevance and lead generation to productivity, sales and customer satisfaction, data helps you see where to focus attention and optimise conversions, brand experience and quality. Analytics also help you measure across the whole process in analysing end-to-end customer lifetime value.
The key goal is to turn data into action. And it’s a lot of what I do in my consulting work to help organisations improve performance of key business processes. We do the review – sometimes a strategic level review, often a process level review – gather data, analyse across both quantitative metrics and qualitative feedback, look at areas for improvement, and make recommendations for prioritising to meet business objectives.
In terms of the customer journey and small businesses, this can be looking at maximising leads, conversions or engagement, interactions and communications more broadly.
For instance, we might look at which traffic sources, lead magnets or emails are getting the most take-up and generating customers.
The difficulty for most business owners is that the data lives in a lot of different places – your content platforms; your social media accounts; your email system or a CRM (Customer Relationship Management) system; your sales system; your client or course delivery platform or membership site.
And of course, there’s google analytics that help you collect visitor data from websites or pixel retargeting for ads. Both work through bits of ‘JavaScript’ code you can integrate that offer insights. They uncover valuable data about your audience to determine which channels drive most of the traffic to your website.
You don’t have to be a programmer to add these to your website, you just create an account and grab them from the provider.
The beauty of creating a business dashboard is so you have one line of sight for all these different pieces, pulling them into a single unified viewpoint that you can monitor and look at the touchpoints you can improve upon.
Building a Single, Unified Line of Sight with a Business Dashboard
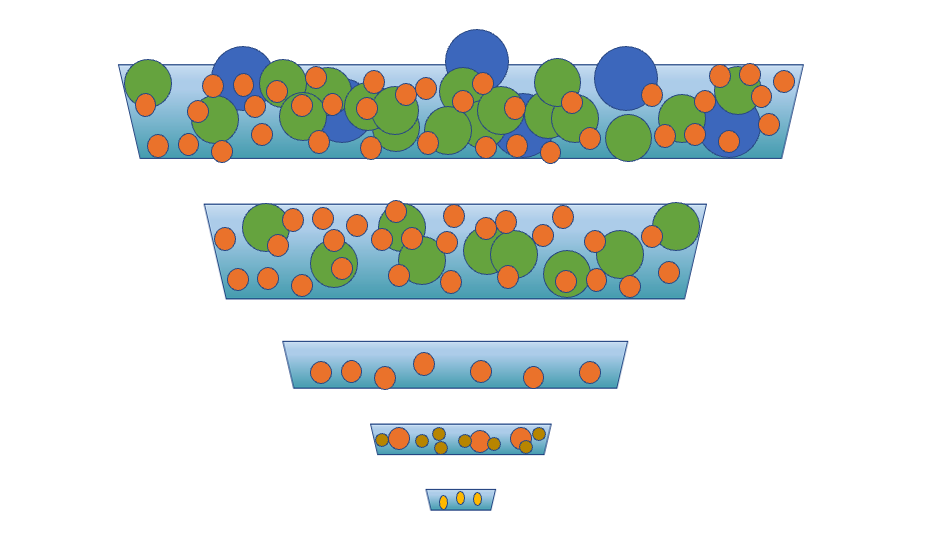
A business dashboard should follow the customer journey of your marketing funnel and sales process. And you expect the numbers to be higher at the start and smaller at the end.
If you think of the shape of a funnel and the job a funnel does – the top is wider and takes more in than what trickles out the end that you collect, contain and use.
Another analogy, which I quite like for this, is a riddle – riddle like you use in your garden not the puzzling question kind. A garden riddle is a large sieve used to separate soil or compost particles, or for separating soil from vegetables.
So, the holes get progressively smaller as you ‘filter’ your prospects through the journey.
Sometimes we go on instincts and when you then look at the data, you realise just how wrong your assumptions are about what you think or feel is going on.
With the latest customer journey mapping technology, every business can now leverage data-driven insights to drive performance.
When you have all of the data across your customers’ journey at your fingertips, it is way more straightforward to identify areas you can improve and proactively take action.
I’m often asked what are the key metrics you should be tracking and where can you get the data you need to create a customer journey map for your business dashboard?
Common Sources of Customer Journey Data
Your customer journey data sources are likely to be held across multiple systems, from your own notes to your online tools, your website, email, contact database, survey info and so forth!
Combining these sources into a single dashboard helps you create a clear and more complete picture of conversions and customer behaviours.
So what are some of the data sources you may want to track?
Well, first let me say there is quantitative data – the metrics that a lot of online systems intrinsically give you. And there’s qualitative data – the more nuanced customer feedback you can ask for.
On the metrics side, the most obvious data is website data. Using analytics tools, you can trace how people find you, where they come from, what devices they’re using, how long they stay on your site or particular pages, where they go next.
Google Webmasters Tools (GWT) is a superb free resource that helps you uncover insightful data about your website visitors. The two resources in GWT you might start with using are Google Analytics and Google Search Console. They’re often mixed up but do quite different jobs with respect to data.
Google Analytics is useful to help improve performance because it not only gives you data on the volume and demographics of your visitors, it shows who is using your site, how they find it, how long they stay on a page.
Google Search Console on the other hand is much more about search engine optimisation – it provides data on who’s linking to your site, any technical errors and the most popular keyword queries driving visitors.
Blair Kelly at Twenty Over Ten wrote a really helpful piece on all of the best metrics to track with each one. I’ve put the link in the show notes for this episode, which you can find back via leveragedbusinesspodcast.com.
Related to this, you can trace user behaviour on your site itself. I’ve mentioned before a lovely little tool called ClickTale, which is now integrated into Contentsquare, a digital analytics tool. You basically embed a code on your pages so you can see how people engage with your webpage.
That can be super insightful for your sales pages where you can see where they hover, where and when they scroll, and with heatmaps you can see visually where the hotspots are for where your visitors spend most time and at what point they click to take action. It’s a great way to find and fix performance issues and just keep improving things all the time.
Other sources of data will be your email system – which should allow you to segment and tag your leads based on what they opted in to receive from you. That means you can make sure you only send them highly targeted, relevant stuff. You can also see where those leads came from, who opened message, who clicked on links and so on.
You may have survey data you can tap into, so if you have a quiz funnel or other way of collecting data from your target market. You may have advertising data if you run paid ads and track it.
There’s social media data, which you can use to see how people interact with you so you can make sure you’re getting a return on the time invested in engagement on any given platform.
If you have a customer service or ticket system, you’ll also see the kinds of questions and problems that people come up against trying to contact you or buy from you. All super important qualitative data.
And of course, there’s sales data – hopefully!
Turning Data Insights into Actionable Improvements
Collecting data and pulling it into a spreadsheet is all well and good. But ultimately, it’s what you do with the data that’s most useful.
Mapping and analysing customer journey means you can see more clearly what needs to happen at each stage of a customer’s relationship with you. Journey analytics makes it easy to analyse end-to-end journeys across channels and time.
And the savvy businesses are really harnessing predictive analytics and creating models of buying behaviour to map the best customer journeys.
From a quality and brand perspective, this can help you know where you need to put something in place that ensures your potential customers have a good experience with you, as well as what to do to prevent dissatisfaction.
And from a revenue and profitability perspective, it helps you optimise at each touch point to increase sales, downsells and upsells, and avoid refunds.
Customer journey analytics also enable teams across your organisation to increase operational efficiency and make cost savings.
By creating a business dashboard right across your end-to-end customer journey, you can implement best practices at each stage to create an engaging experience that outperforms the competition.
7 Steps to Create a Business Dashboard
Step #1 – Map out your end-to-end customer journey visually
Step #2 – Locate customer journey data
Step #3 – Identify targets for each stage of your customer journey
Step #4 – Decide how frequently you will track the data
Step #5 – Apply your data to your customer journey map
Step #6 – Establish procedures for monitoring goals
Step #7 – Identify action to optimise each touch point across the customer journey
One of the simplest ways I know to do this is to create a spreadsheet with each target stage or touchpoint forming the columns and setting out rows for each part of your campaign or launch sequence.
I’ve provided a few different example templates in the show notes for this episode, so you get a sense of what yours might look like. Totango provide a really nice set of examples too.
In fact, they take the customer journey well beyond client acquisition and show also the steps for onboarding through to loyalty/advocacy so you can continue to track and optimise lifetime customer value.
So to sum up, customer journey analytics help you leverage all the other PR, marketing and sales work that you do. When a customer hits a roadblock in their journey, it can hinder the customer experience, lose you sales and drive up operational costs.
Journey analytics help you find the road blocks as well as opportunities to streamline inefficient parts of a process, which then reduces customer confusion and frustration and decreases your cost-per-acquisition and cost-to-serve.
With a business dashboard tracking each step in the customer journey, you can dig into where you’re losing people. You know where to look for solutions to any holes in your funnel.
Hope that’s useful, please do let me know and get in touch with any questions. You can contact me directly or via the FB group, click the banner below to join.
